
wibowo
@wibowo
Software Engineer with FIP match running in picture-in-picture.
5 articlesJoined July 2024
Vibe Coding: Being Result-Oriented Is Fine. Being Result-Only Is the Problem.
I’m a software engineer. I do vibe code. I’ve been writing software for a long time, long enough that reading code is more natural to me than reading prose. And somewhere in the last year I became a vibe coder. I describe what I want, the AI writes it, the tests pass, I ship. It’s fast, it’s fun, and I’m not going back. But there’s an old habit I can’t shake, and I don’t think I should. I want to know how it works. Not every line; I gave that up happily. But when a user hits “place order,” I want to know what runs, in what order, where the retry lives, and whether the AI quietly went around a layer I care about. For years that knowledge came for free, because I was the one typing. Now I ship things I could not draw on a whiteboard, and that bugs me. Vibe coding isn’t broken; it’s doing what it promised. It’s result-oriented. I judge the output, the AI optimizes for the output, and the path in between becomes something nobody looks at. I just happen to be the kind of engineer who still wants to look. And a normal code diff doesn’t help me there: it shows which lines moved, not what the app does differently. There’s a newer wave of tools that hand the AI (and you) a map of the codebase instead of a pile of files. Graphify and CodeGraph are the big names. They build a graph of what connects to what, and they’re great at it. But a graph tells you that A talks to B. It doesn’t tell you when, in what order, or only-if-something-failed. So, inspired by Graphify, I built VibeSequence. Where Graphify maps your codebase as a knowledge graph, VibeSequence maps it as a list of user sequence diagrams, one for each thing a user can do. It adds the part a graph leaves out: the order of calls, drawn as a sequence that both you and your AI can read. This post is about why I wanted it and how I use it to get the process back without giving up the speed. A quick demo of VibeSequence: building the diagrams from a codebase, zooming into one flow, and playing it step by step. What VibeSequence actually does You point it at a project (vibesequence build .), it reads the code without running anything, finds the entry points (web routes, CLI commands, that kind of thing), and draws each one as a flow you can zoom in and out of. Zoomed out you see which parts of the app talk to each other. Zoomed in you see individual functions. I didn’t set out to replace a graph; I set out to add the thing a graph can’t show, which is order, and the branches around each step. Three things make it useful when an AI is doing the typing: Play mode. Step through a flow one arrow at a time, each pointing at the exact file and line. It’s like a debugger, except you’re reading instead of running. Live diff. While the AI edits, the steps that changed turn green, and you can play just those. So code review stops being “which lines changed” and becomes “what does the app do differently now.” A text version for the AI. The same diagram comes out as a compact text tree, so the AI can read one flow instead of opening eight files. There’s also a “who calls this?” command that tells you which user-facing flows would break if you changed something. Fair warning: it’s tiny and young. Sixteen stars, one maintainer (me), Python and JavaScript/TypeScript only. I ran a small test with Claude Code and I’ll be honest about the numbers: when the AI had to understand a flow, it used about a quarter fewer tokens and finished in half the turns. For small edits it actually cost a bit more, because the AI still has to read the files it changes. Go, Java and a few other things are on my roadmap, not shipped yet. There’s a one-line install that teaches Claude Code to check the flows on its own after each edit. All of that is from the project README as of today. My loop: vibe code, then look at the sequence Here’s the routine. It adds maybe two minutes a session, and it plays fine alongside a graph tool if you already use one: the graph helps the AI find code, the sequence shows you what it did. Snapshot before. Build the diagrams before the AI touches anything. That’s the shape you want to keep. Vibe code. Paste an existing flow into the prompt if you want the new one to follow it. Leave the viewer open; changed steps turn green on their own. Diff the sequence after. Rebuild, play the green steps, and ask: did anything skip a layer, grow sideways, or lose a step it needed? If not, ship. Step 3 is the one I never skip. Steps 1 and 2 I scale with how much the session could bend the shape; for a one-line fix the map barely helps, and my own numbers say so. Wrapping up Wanting to understand your own system doesn’t make you a dinosaur. It’s the part of being an engineer I want to keep while the AI does the typing. “It works” only describes the result, and I’ve watched the result stay green while the process underneath quietly went wrong. A sequence diagram that redraws itself after every AI edit is the closest thing I’ve found to seeing the process without giving up the speed. That’s why I built VibeSequence. It’s early and narrow, but if you’re the same kind of engineer, it’s a pip install away, and a free afternoon is enough to try it on one of your own projects. Issues and PRs welcome. Links: VibeSequence. The graph tools mentioned along the way: Graphify and CodeGraph.
6 min read2062
I Estimated the Real Dollar Value of Claude's Deep Research and Why Keeping It to Yourself Is a Waste
Every time you run the deep research feature on Claude, there's a real computational cost behind it. Tokens get processed, the model "thinks" through extended reasoning, web searches run, and a long answer gets assembled. That cost is invisible to the individual user because it's wrapped into one flat price, which is a monthly subscription. But once we try to translate that into an actual dollar figure, the picture gets interesting and that’s what this article digs into. Foto oleh Google DeepMind di Unsplash This piece tries to answer two questions: what does one deep research session actually cost when converted to API pricing, and what happens to that value when the resulting research is shared publicly instead of kept to yourself. What Claude.ai Subscriptions Cost Right Now Before getting into the math, it helps to align on the baseline pricing. Claude Pro is $20/month, and includes access to the latest models, extended reasoning, and MCP connectors. For users who need more headroom, there are two Max tiers: Max 5× at $100/month and Max 20× at $200/month, offering five and twenty times Pro's usage allowance respectively. Outside of subscriptions, there's also the Claude API, billed per token. That's the yardstick we'll use to translate one research session into a concrete dollar figure. Pricing Out a Single Deep Research Session A deep research session isn't a single back-and-forth exchange. Several components contribute to the token count: Component Estimated Tokens Notes Initial input (prompt + context) ~10,000 Question and instructions Web search & fetch ~20,000 Articles retrieved and processed by the model Extended thinking ~30,000 Internal reasoning before answering Final output ~5,000 Roughly 3,500–4,000 words of research output Total ~65,000 tokens For an Opus-class model, API pricing runs $15 per million input tokens and $75 per million output tokens. Based on the assumptions above, the rough math is: Input (including web search and thinking): 60,000 tokens × $15/million ≈ $0.90 Output: 5,000 tokens × $75/million ≈ $0.375 Total per session: roughly $1.27 This is obviously an estimate and it could be lower with a Sonnet-class model, or higher for a much longer and more complex research task. But as a rough benchmark, one reasonably thorough deep research session is worth a little over a dollar if paid for directly through the API. How Many Sessions Does One Subscription Actually Buy? The next question: out of the $20/month paid for Pro, how many deep research sessions does that actually translate to? This is a bit messy because Claude doesn't meter usage per message, it meters by computational load. A short conversation can consume a much smaller share of quota than a single deep research session involving many tool calls and long reasoning chains. The difference can run 10–20x. With a conservative assumption, an active Pro user running this feature regularly might get somewhere around 15–20 deep research sessions per month before hitting the limit. Mapped to API-equivalent value: Plan Price/month Est. Sessions/month Equivalent API value Difference Pro $20 ~15–20 ~$19–25 roughly break-even Max 5× $100 ~75–100 ~$95–127 modest savings Max 20× $200 ~300–400 ~$380–500 meaningful savings The takeaway so far: from a pure compute-cost standpoint, the Pro subscription is roughly break-even against API pricing. The real value of subscribing isn't dollar savings, it's convenience: no API billing to manage, no token limits to track, no infrastructure to maintain. The Turning Point: What Happens When Research Gets Shared This is where the math gets more interesting. Up to this point, a single deep research session worth roughly $1.27 in compute cost. Typically stops with one person: whoever ran it. The output sits in a chat history, maybe gets copied into personal notes, and that's it. Now picture a different scenario: that research gets published as a public article. Someone else who needs similar information no longer has to run the research from scratch, they just read it. Run the numbers with conservative assumptions: One Pro user runs 15 research sessions per month ($20) Every result gets published as an article Each article is read by an average of 500 people (a reasonable figure for a niche article shared within a community or on social media) Without that article, some share of those 500 readers would likely have sought the same information another way — including running their own AI research If all 500 of those readers had to run equivalent research independently through the API, the total cost would be 500 × $1.27 ≈ $635 per article. Multiplied across 15 articles a month: Metric Value Subscription cost $20/month Articles published 15/month Readers per article (estimate) 500 people Compute value per research session $1.27 Total potential value saved for the community ~$9,525/month Ratio vs. subscription cost ~476× That 476× figure is obviously not a precise calculation, it depends entirely on assumptions about reader count and how relevant the research is to them. But the underlying direction holds: the value of one research session doesn't disappear after the first person reads it. Once published, the same value can be reused by different people, with no additional compute cost for each subsequent reader. Why This Matters There's a real access gap in how AI gets used today. Not everyone can afford a $20/month subscription, let alone $100–200 for a Max tier. Not everyone has the time or the skill to write a good research prompt either. But once one person has done that research well and shared it openly, others without the same access can still benefit from it for free, without needing to understand how the AI works at all. This isn't a new argument. Libraries, open-access journals, and Wikipedia all run on the same logic. But with AI capable of producing deep research in minutes, the scale and speed at which knowledge could be distributed this way is potentially much larger than before. Provided there's a channel that makes "research on AI, then publish publicly" as frictionless as possible. How to Actually Share It: The Frasa Connector All of this math is interesting in theory, but it only matters if sharing research is actually easy. If publishing a deep research session requires copy-pasting into a separate publishing tool, reformatting, and manually posting it somewhere, most people simply won't bother and the 476x multiplier stays theoretical. This is the gap the Frasa connector for Claude.ai is built to close. Frasa is a custom MCP (Model Context Protocol) connector that lets Claude publish directly to Frasa.io. Turning a finished research session into a public article without leaving the chat. Setup takes three steps: Open Custom Connectors in claude.ai settings Enter the Frasa MCP server (api.frasa.io/mcp) Connect — done. Claude can now publish to Frasa on request Once connected, the workflow looks like this: Run deep research in Claude → ask Claude to publish it via Frasa → it's live as a public article on Frasa.io With the connector, there are no extra steps. You don't copy, reformat, or repost anything. The gap between "I just learned something useful" and "other people can now read it" basically disappears. The connector doesn't change the math from before. It just makes that math real. The 476x multiplier only happens if sharing is as easy as the research itself, and this is what makes it that easy. So the earlier numbers come down to one simple point. The question was never whether research is worth sharing, because it clearly is. The hard part was always the effort it took to share it. When you drop that effort close to zero, sharing stops being a rare one-time thing and becomes a normal habit for thousands of people.
7 min read6960
The Bill at the Warteg Table: How a Weakening Rupiah Reaches the Plates of Those Who Never Touch a Dollar
I often eat at the warteg near my rented place. Something there is hard to swallow, not in my throat, but in my chest. Photo by Falaq Lazuardi on Unsplash People come in, only pick one side dish, then ask for extra rice. They aren't economizing because of some frugal living trend going around on social media. They're day laborers, construction workers, people whose bodies have been working since dawn and will likely keep working until the sun goes down. One side dish, lots of rice. That isn't a menu choice. It's a survival calculation: how to fill the stomach with the cheapest calories so there's enough energy for tomorrow's work, and still safe some money. What stays with me most: some of them eat, then write down their own order on a notepad the warteg leaves out, a simple bon system that runs on trust, and then they leave. Not much talking. No cash changing hands in plain view. Just a small trust quietly doing its work. And in one corner of the warteg wall, there's a small handwritten note: "Discount for ojol drivers." It doesn't read like a promo. It reads more like an acknowledgment, that the owner knows exactly who walks in here, and chooses to take a side in their own simple way. Solidarity that needs no stage. Just written with a marker, among the list of dishes and prices. When the Rupiah Reaches the Plate While I ate, my phone screen carried the news that repeats nearly every day: the rupiah is weakening again. Past 17,800, closing in on 18,000 to the dollar. One of the weakest in Asia, down almost 3% in a single month. But in this warteg, nobody is talking about it. The day laborer asking for extra rice has never held a single dollar bill in his life. He has no foreign-currency savings, no gold bars, no stocks to sell off when panic hits. His entire life, his wages, his meals, his rent, pulses in rupiah. And precisely because of that, he is the first to feel it when the rupiah falls. Take the simplest example, one that might be on his plate right now: tempe. We often take pride in tempe as the food of the people, the most humble protein, a symbol of Indonesia's self-sufficient kitchen. But the reality is, it isn't that self-sufficient. Indonesia imports more than 85% of its soybean needs, and around 91% of those imports come from the United States. Domestic soybean productivity is too low to cover demand, leaving a structural deficit of about 2.5 million tons a year that forces Indonesia to stay in the import market whether world prices are high or low. Which means the tempe on that warteg plate is, fundamentally, bought with dollars. Because the transactions are made in US dollars, every weakening of the rupiah automatically pushes up the price of soybeans at home. The rupiah that drops on a Bloomberg screen, weeks later, turns into thinner slices of tempe in the warteg display. Not gone all at once, but shrinking quietly. Ten pieces become eight, thick becomes thin, until eventually the owner is forced to raise prices, or that day laborer is forced to drop tempe from his choices. The irony grows more bitter when you look at who benefits. Domestic soybean prices stay high even when global prices are falling, with the gap between the international price of around Rp6,800 per kg and the retail price of Rp13,900 per kg so wide that importers' potential profit is estimated to reach Rp12.9 trillion in a year. And the ones who feel the burden of these raw-material costs most are ordinary people, precisely because soybeans are the most affordable source of protein they have. A weakening rupiah, in other words, is a tax that is never put to a vote in parliament, but its bill arrives at the warteg table of those least able to pay it. Those who hold dollars stay relatively safe. Those who hold no dollars, whose entire existence is tethered to the rupiah and a slice of tempe, carry the heaviest weight. The Line Between Surviving and Living This is where I became aware of a thin line we often ignore. There's a difference between surviving and living. Surviving is one side dish with lots of rice. Living is being able to choose a dish without counting. Surviving is working so you can eat tomorrow. Living is working for something more than just eating tomorrow. Most of our public conversation, about economic growth, about poverty figures that supposedly keep falling, about middle-income country status, measures surviving. Not starving is treated as enough. Not being below the poverty line is treated as success. But the poverty line only measures whether a person is still alive, not whether they are living a life. The worker at that warteg, statistically, might not count as poor. He works, he eats, he doesn't beg. On paper, he's a development success story. But anyone who sees his eyes as he counts side dishes knows that "not poor" and "a decent life" are two places far apart. A State Too Busy with Itself In a country that calls itself rich, rich in resources, rich in potential, rich in rhetoric, that gap between surviving and living should be the state's central concern. But the state is often busy with itself. With politics, with projects whose budgets keep swelling, with corruption that seems to have become a fixed cost of nationhood. Economic figures are used more often as rhetorical tools than as a mirror of reality. So what patches that gap isn't policy, but small acts of solidarity. The warteg owner who offers ojol discounts. The bon system that runs on trust. Fellow workers covering for each other's shortfalls. That kind of empathy is beautiful. But it shouldn't be the only safety net. The warteg owner's empathy was never designed to carry the structural weight that the state should bear: fair wage policy, currency stability, jobs that let people live rather than merely survive. What's Written on the Wall I looked again at the marker writing on the warteg wall. "Discount for ojol drivers." There's something deeply human in it. An acknowledgment that the people who come here are struggling, and that the struggle deserves respect, not through pity, but through concrete solidarity. But I'm also aware that a nation cannot be built on a marker pen and the kindness of a warteg owner. Grassroots solidarity is a sign that the people still have heart. It is not a sign that the system is fine. Quite the opposite, it appears because the system has failed. Every halal job is indeed noble. But the nobility of work must not become an excuse to let people work hard their whole lives just to survive. Because in the end, everyone sitting in that warteg, with one side dish and a heaped plate of rice, deserves more than mere survival. They deserve to live.
6 min read8060The Seven Corners That Ended a 22-Year Wait
There is no extra credit for the way you score. A header from a corner counts the same as a curling shot from 25 yards. Arsenal scored 24 goals from set pieces in the league. Their rivals did not. That is not an exploit. That is a coaching decision, executed brilliantly, over the course of an entire season. Photo by Nelson Ndongala on Unsplash A coaching appointment, July 2021 When Arsenal hired Nicolas Jover from Manchester City in July 2021, the announcement barely registered. He was a 39-year-old French set-piece specialist, lured across London on the back of Mikel Arteta's connections from his own time as Pep Guardiola's assistant. The hiring of a specialist coach for one phase of play was unusual but not headline-grabbing. Arsenal had finished eighth the season before. There were bigger problems than corners. Five seasons later, Jover's name is the answer to one of the most consequential questions in modern Premier League history: how did Arsenal end a 22-year title drought in a season where their open-play attack was, by Mikel Arteta's own admission, not good enough to win the league? The answer is seven matches. Seven moments. Seven corners — or set pieces close enough — that turned almost-certain draws and losses into wins. Sixteen points. The exact margin between a championship and a 23rd year of waiting. This is the story of those seven moments. 17 August, Old Trafford — Calafiori, minute 13 It is the opening day of the season. Arsenal have not won at Old Trafford against Manchester United in the league since September 2020. The match is still in its first quarter when Declan Rice steps up to take an inswinging corner from the left. Altay Bayindir, Manchester United's goalkeeper, comes for it, flaps, and misses. Riccardo Calafiori is six yards out and unmarked. The header is almost a formality. Without that goal, Arsenal probably draw 0-0. Open-play chances are scarce; Bayindir would not be tested in any meaningful way for the rest of the match. The corner is the difference. Counterfactual cost: two points. Running total: 2 dropped. 29 September, St James' Park — Gabriel, minute 90+5 Arsenal have lost their last three visits to Newcastle. They are losing this one too, until the 84th minute, when Mikel Merino glances in a Rice cross to make it 1-1. Then deep into stoppage time, a corner from the right. Gabriel Magalhães — who had been partly at fault for Nick Woltemade's opener — rises and heads home from a corner. He sprints to the away end with his arms wide. Without that goal, Arsenal draw 1-1 in a match they were losing twenty minutes earlier. Counterfactual cost: two points. Running total: 4 dropped. 18 October, Craven Cottage — Trossard, minute 58 Fulham have been a bogey side for years. The first half is dire — Arsenal cannot get into the game, and Saka admits afterwards that his early corner deliveries were "rubbish." Then, in the 58th minute, one isn't. Saka's inswinger finds Gabriel at the back post. Gabriel flicks it on. Leandro Trossard, lurking, knees it over the line from close range. It is Arsenal's 50th goal from a corner since the start of the 2022-23 season. No other Premier League side has more than 34 in that period. Arsenal win 1-0. Without the corner, they draw 0-0 — Fulham don't muster a shot on target all game. Counterfactual cost: two points. Running total: 6 dropped. 26 October, Emirates Stadium — Eze, minute 8 This one bends the definition slightly. A free-kick is delivered into the Crystal Palace box. Palace head it clear. But the ball drops to Eberechi Eze — playing his first home league match against his former club — and Eze meets it with a left-footed scissor kick. Top corner. Some statisticians wouldn't call this a set-piece goal. Most, including Opta, would: the entire sequence originated from a dead-ball delivery, and the second-phase recovery is part of how Arsenal's set-piece routines are designed. There is nothing else in the match. Arsenal win 1-0; without Eze's strike, 0-0. Counterfactual cost: two points. Running total: 8 dropped. 13 December, Emirates Stadium — Saka and Saka again Wolves are bottom of the table and Arsenal cannot break them down. The 70th minute arrives with no goal. Then Saka swings in a corner that ricochets off the post, hits goalkeeper Sam Johnstone in the back, and rolls into the net. Recorded as an own goal. But it came from Saka's corner. Wolves equalise through Tolu Arokodare in the 90th minute. The Emirates groans. Two minutes into stoppage time, another Saka corner. This one deflects off Wolves defender Yerson Mosquera. Own goal. 2-1. Both of Arsenal's "goals" are own goals from Saka corners. Without them, Arsenal lose 0-1 to the team that will be relegated in May. Counterfactual cost: three points. Running total: 11 dropped. 1 March, Emirates Stadium — Saliba and Timber Chelsea are third when they visit the Emirates. Saliba opens the scoring from a Saka corner, headed across goal by Gabriel. Just before half-time, Hincapié inadvertently flicks a Reece James corner into his own net to equalise. Chelsea start the second half on top. Then, in the 66th minute, Timber meets a Rice corner and Robert Sánchez — caught between coming and staying — appears to duck under it. 2-1. Pedro Neto is sent off shortly after for a second yellow. Chelsea cannot recover. But the structure of Arsenal's win is unmistakable: two goals, both from corners. Without them, 0-1 loss to a top-four rival. Counterfactual cost: three points. Running total: 14 dropped. 18 May, Emirates Stadium — Havertz, minute 37 The title is one win away. Burnley are already relegated. The Emirates is anxious — Saka has appealed for a penalty and been denied, Trossard has hit the post, Eze has clipped the crossbar. Then Saka takes a corner. Havertz times his run from deeper space, rises unchallenged in the six-yard box, and heads it down into the net. It is Arsenal's 18th goal from a corner in the Premier League season — a new competition record. It is also the only goal of the game. Arsenal win 1-0; the title is mathematically clinched the following Tuesday when Manchester City drop points at Bournemouth. Without the Havertz header, the match ends 0-0 and the title race goes to the final day. Counterfactual cost: two points. Final total: 16 dropped. Sixteen points Arsenal finished the 2025-26 Premier League season on 82 points, four clear of Manchester City. Strip those sixteen points away — strip those seven moments away — and Arsenal end the season on 66. That puts them third. Behind Manchester City on 78. Behind Manchester United on 68. Above Aston Villa on 62. Three goals from corners. Two own goals from corners. One header from a cleared free-kick. One late corner deep in stoppage time at St James' Park. Seven moments. One coach. One title. What Jover actually does The mechanics of Jover's work have been picked apart endlessly. Late runs from deep positions to exploit zonal-marking gaps. Blockers occupying defenders to free runners. Specifically designed routines for specific opponents. Second-phase positioning so that if the first ball is cleared, Arsenal are in the right spots to win the recovery. But the more interesting thing about Jover's contribution is what it tells us about where the marginal value of coaching lies in elite football. In a Premier League where top teams are tactically and physically converged, where every side presses and counter-presses and has a possession structure, the differences between teams in open play are vanishingly small. A great open-play coach might buy a side an extra goal every three or four games over a season. That's worth a lot, but it is incremental. A great set-piece coach can buy you a goal in a match where you would otherwise have scored zero. Not an extra goal — a goal where there would have been none. That is a categorically different kind of value. It is the difference between making good teams better and making good teams win. Arsenal won eight 1-0 matches in the Premier League this season, their second-most in a campaign behind only 1998-99. Five of those eight 1-0 wins involved decisive set-piece goals. The team's identity — defensive solidity plus set-piece reliability — was specifically the identity of a team built to convert the tight matches that decide titles. A note on luck It is worth saying clearly: not all of these seven moments are pure coaching. Bayindir's flap at Old Trafford is a goalkeeper error. Johnstone's ricochet against Wolves is partly fortune. Sánchez ducking under Rice's corner is a moment of confusion as much as a moment of design. Arsenal benefited from things going their way. But this is true of every champion. Manchester City would not have won six of the previous eight titles without Ederson having occasionally spectacular days. Liverpool's 2019-20 was built partly on a few set-piece goals from Virgil van Dijk that found their target through margins of inches. The question is not whether luck plays a role — it always does — but whether your tactical structure is designed to maximize the matches in which luck matters. Arsenal's set-piece structure forces goalkeepers into more difficult decisions. It puts more bodies in the six-yard box than opponents can comfortably mark. It rebounds off more legs because there are more legs in the way. The seven moments above are not all "Jover did this." But they are all moments where Jover's system created the conditions under which they could happen. A 22-year wait The last time Arsenal won the league, in May 2004, they did it as the Invincibles — unbeaten, attacking, beautiful. Thierry Henry scored 30 league goals. Robert Pires scored 14. Freddie Ljungberg scored four. The whole side functioned as an open-play organism. The 2025-26 Arsenal will be remembered differently. They will be remembered as the set-piece kings, the team that perfected the dark art of the corner, the side that made Premier League goalkeepers afraid of the inswinger. There is a slight ambivalence in the way this title has been received — some commentators have written, with varying degrees of grace, that Arsenal won it by exploiting a tactical loophole rather than by being the best team in open play. That criticism mistakes what football is. Football is a game in which goals decide matches and matches decide titles. There is no extra credit for the way you score. A header from a corner counts the same as a curling shot from 25 yards. Arsenal scored 24 goals from set pieces in the league. Their rivals did not. That is not an exploit. That is a coaching decision, executed brilliantly, over the course of an entire season. Seven of those goals decided seven matches. Those seven matches were the difference between champions and bronze-medallists. Nicolas Jover, hired in obscurity in July 2021, may be the most consequential coaching appointment in English football this decade. The corner kick, that humblest of dead balls, was the weapon. Arsenal were the team that pointed it correctly. Sources: match reports from The Athletic, ESPN, Sky Sports, Opta Analyst, Arsenal.com, BBC, and Wikipedia's 2025-26 Arsenal F.C. season page. Final Premier League standings from NBC Sports. Methodology and counterfactual analysis based on a static-counterfactual model — i.e. assuming all other match events held constant.
10 min read9300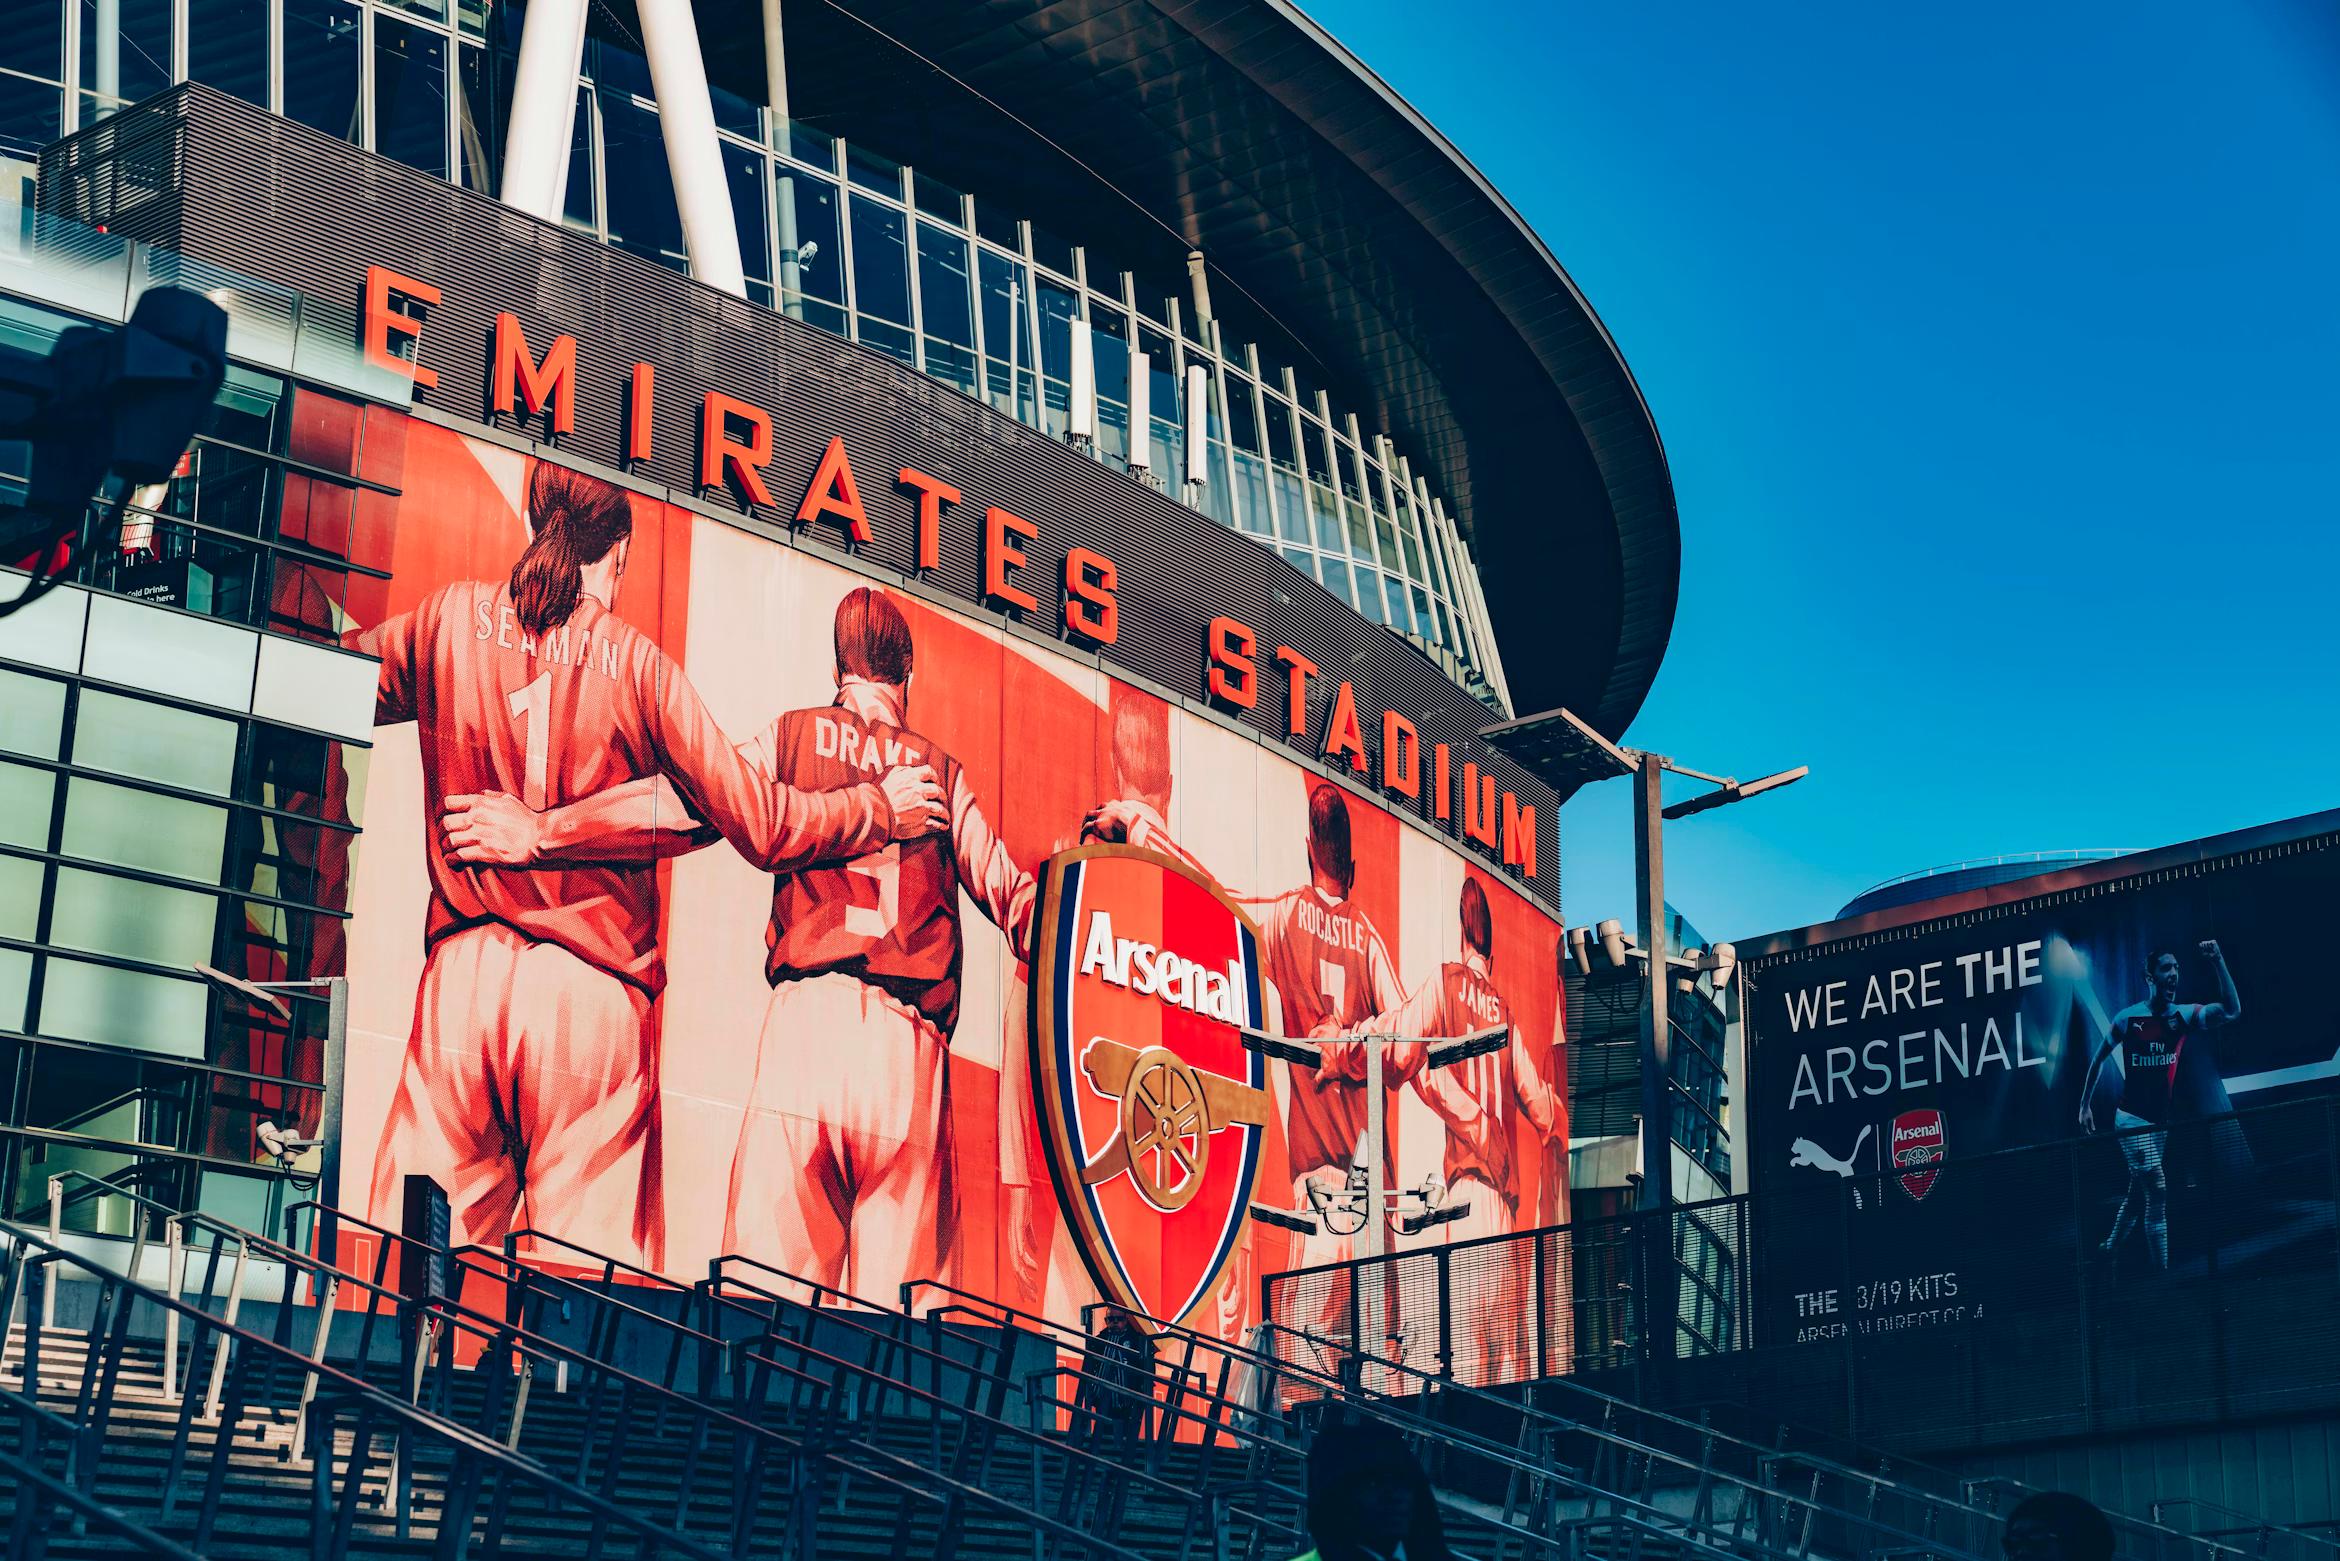
Real-Time AI Assistant That Sees, Listens, and Talks — Here's How
Here’s what makes this exciting: the ability to interact with an AI assistant in real-time using both voice and visual inputs creates a more immersive and natural user experience 音声と視覚の両方の入力を使用してリアルタイムでAIアシスタントと対話できる能力が、より没入感のある自然なユーザー体験を生み出します The combination of voice and visual inputs alongside real-time AI interaction creates a more immersive and natural user experience, enhancing user engagement with an AI assistant that responds in a human-like manner.
1 min read4.3K1
